Financial Report (shortened sample w/ tables)
Balance Sheet
December 31, 2019
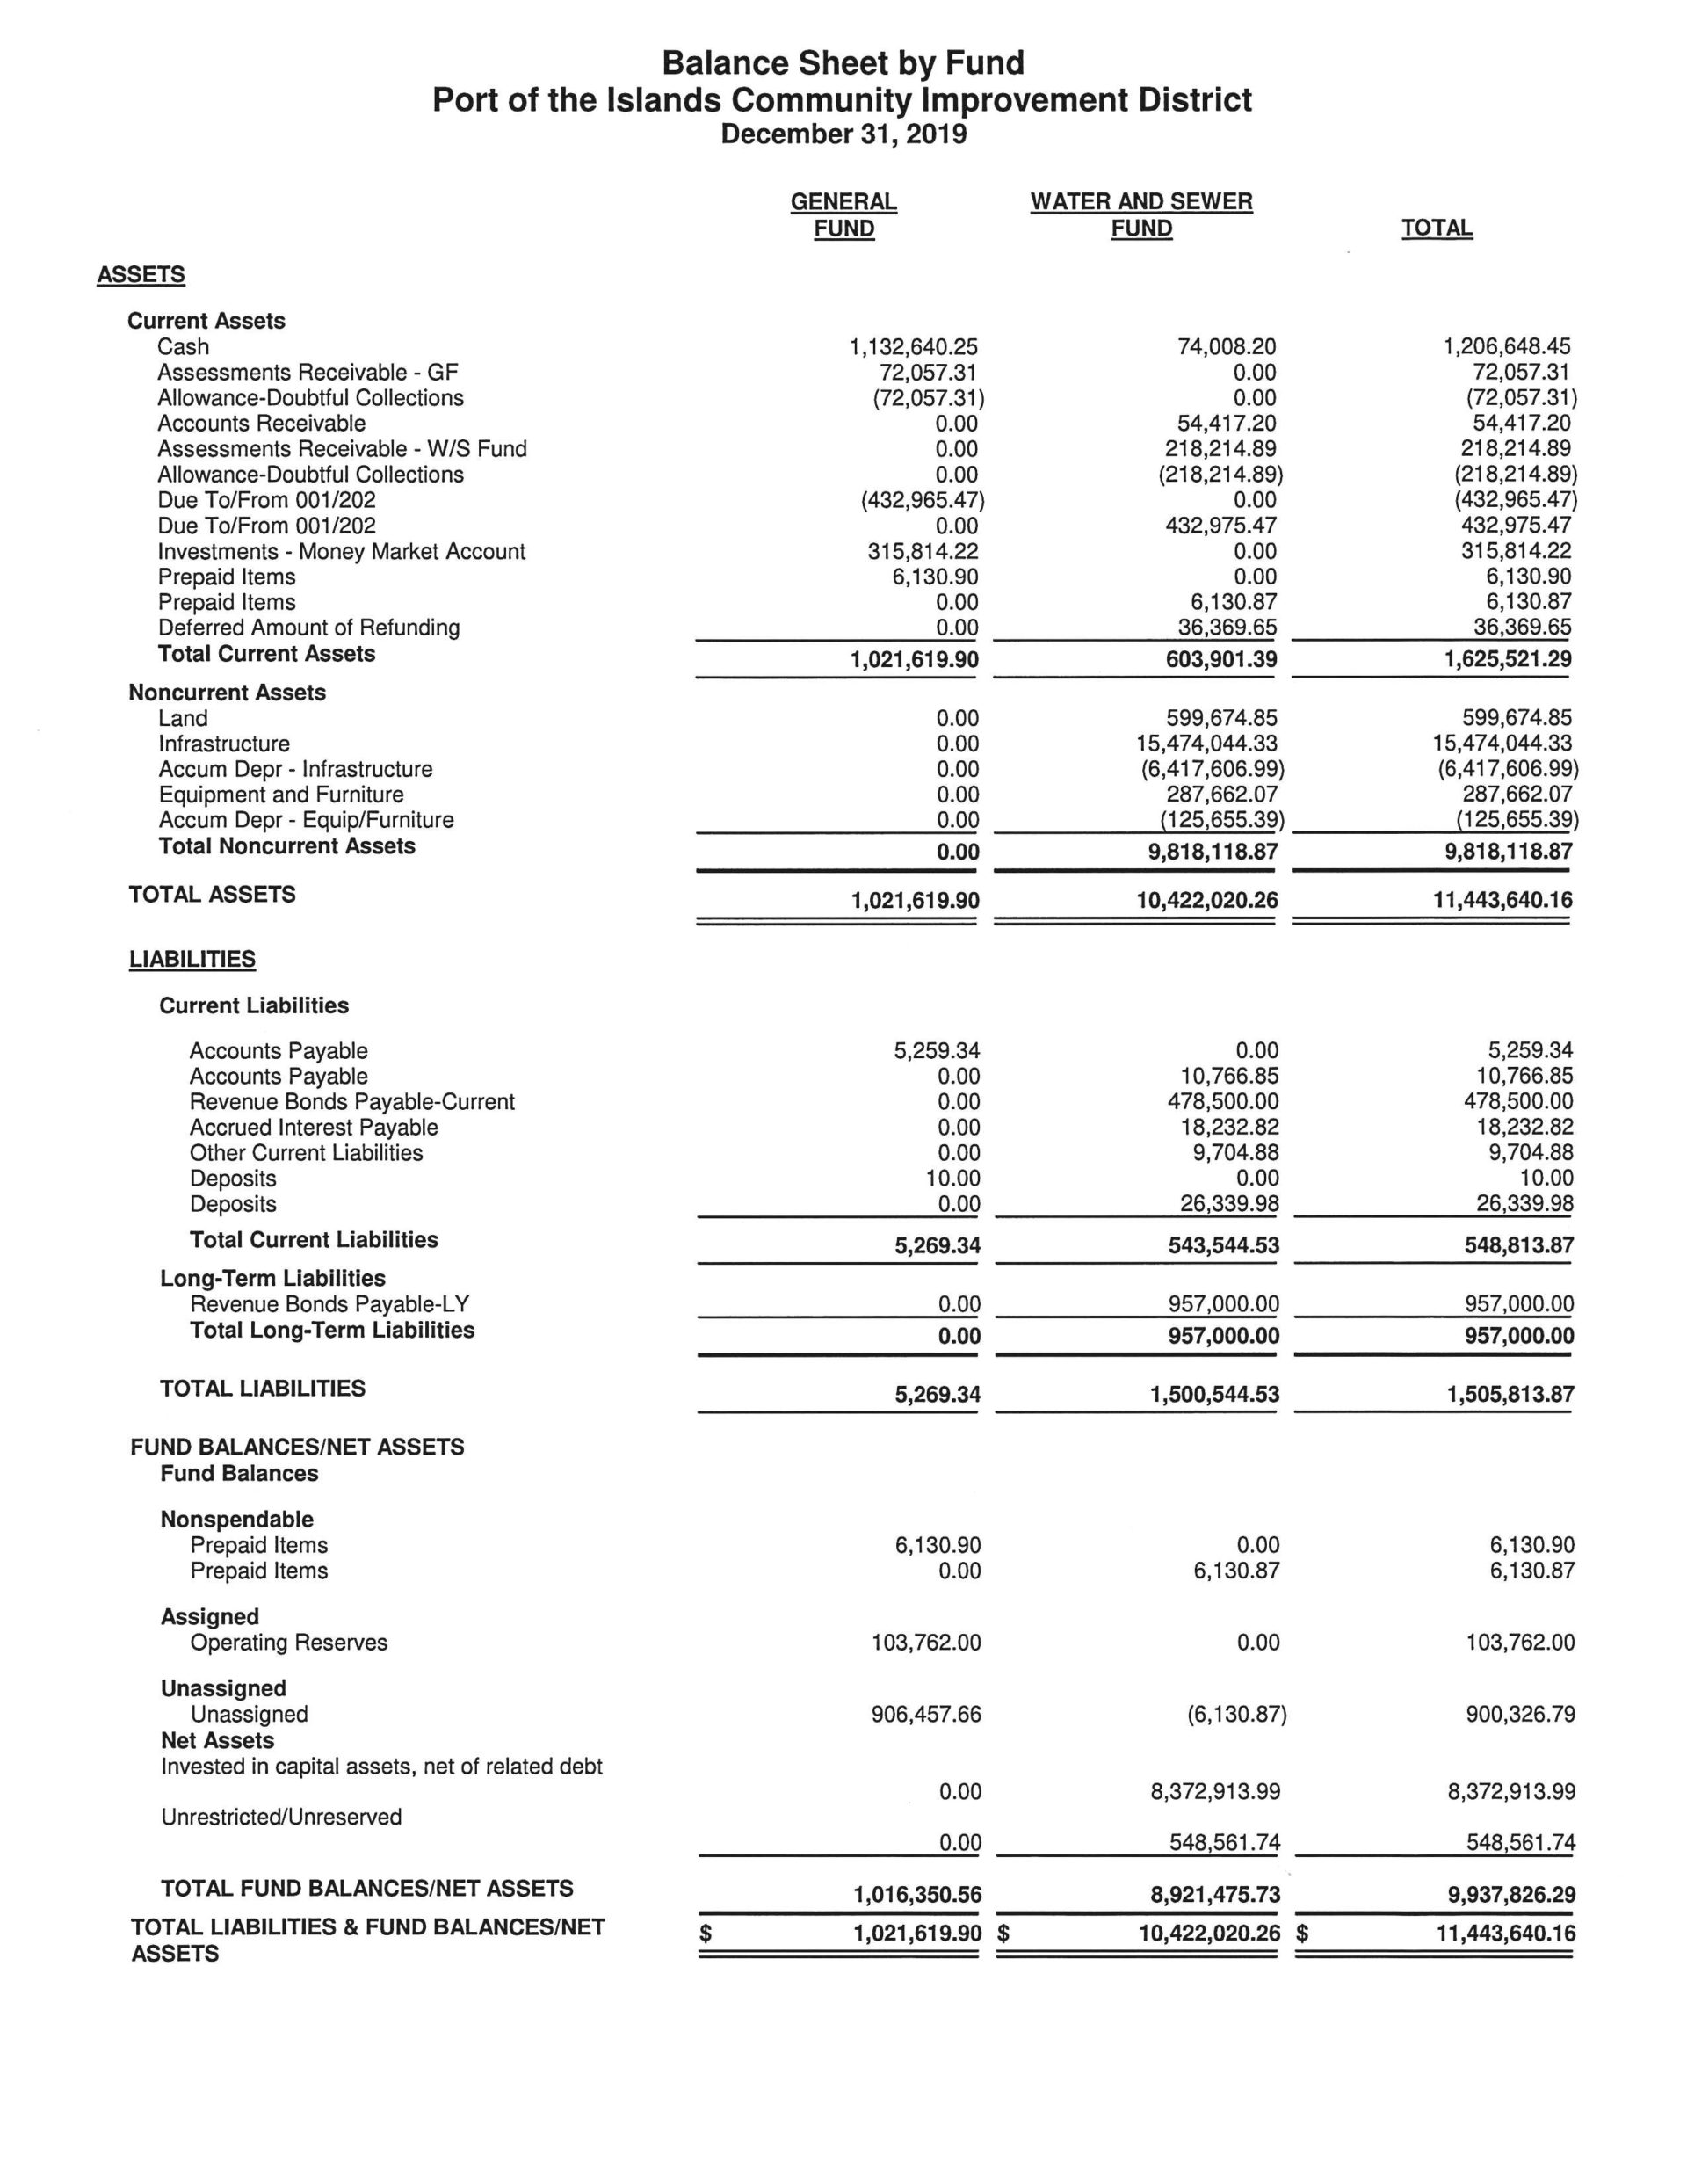
| Balance Sheet by Fund December 31, 2019 | ||||||
|---|---|---|---|---|---|---|
| GENERAL FUND | WATER AND SEWER FUND | TOTAL | ||||
| ASSETS | ||||||
| Current Assets | ||||||
| Cash | 1132640.25 | 74008.2 | 1206648.45 | |||
| Assessments Receivable – GF | 72057.31 | 0 | 72057.31 | |||
| Allowance-Doubtful Collections | -72057.31 | 0 | -72057.31 | |||
| Accounts Receivable | 0 | 54417.2 | 54417.2 | |||
| Assessments Receivable – W/S Fund | 0 | 218214.89 | 218214.89 | |||
| Allowance-Doubtful Collections | 0 | -218214.89 | -218214.89 | |||
| Due To/From 001/202 | -432965.47 | 0 | -432965.47 | |||
| Due To/From 001/202 | 0 | 432975.47 | 432975.47 | |||
| Investments – Money Market Account | 315814.22 | 0 | 315814.22 | |||
| Prepaid Items | 6130.9 | 0 | 6130.9 | |||
| Prepaid Items | 0 | 6130.87 | 6130.87 | |||
| Deferred Amount of Refunding | 0 | 36369.65 | 36369.65 | |||
| Total Current Assets | 1021619.9 | 603901.39 | 1625521.29 | |||
| Noncurrent Assets | ||||||
| Land | 0 | 599674.85 | 599674.85 | |||
| Infrastructure | 0 | 15474044.33 | 15474044.33 | |||
| Accum Depr – Infrastructure | 0 | -6417606.99 | -6417606.99 | |||
| Equipment and Furniture | 0 | 287662.07 | 287662.07 | |||
| Accum Depr – Equip/Furniture | 0 | -125655.39 | -125655.39 | |||
| Total Noncurrent Assets | 0 | 9818118.87 | 9818118.87 | |||
| TOTAL ASSETS | 1021619.9 | 10422020.26 | 11443640.16 | |||
| LIABILITIES | ||||||
| Current Liabilities | ||||||
| Accounts Payable | 5259.34 | 0 | 5259.34 | |||
| Accounts Payable | 0 | 10766.85 | 10766.85 | |||
| Revenue Bonds Payable-Current | 0 | 478500 | 478500 | |||
| Accrued Interest Payable | 0 | 18232.82 | 18232.82 | |||
| Other Current Liabilities | 0 | 9704.88 | 9704.88 | |||
| Deposits | 10 | 0 | 10 | |||
| Deposits | 0 | 26339.98 | 26339.98 | |||
| Total Current Liabilities | 5269.34 | 543544.53 | 548813.87 | |||
| Long-Term Liabilities | ||||||
| Revenue Bonds Payable-LY | 0 | 957000 | 957000 | |||
| Total Long-Term Liabilities | 0 | 957000 | 957000 | |||
| TOTAL LIABILITIES | 5269.34 | 1500544.53 | 1505813.87 | |||
| FUND BALANCES/NET ASSETS | ||||||
| Fund Balances | ||||||
| Nonspendable | ||||||
| Prepaid Items | 6130.9 | 0 | 6130.9 | |||
| Prepaid Items | 0 | 6130.87 | 6130.87 | |||
| Assigned | ||||||
| Operating Reserves | 103762 | 0 | 103762 | |||
| Unassigned | ||||||
| Unassigned | 906457.66 | -6130.87 | 900326.79 | |||
| Net Assets | ||||||
| Invested in capital assets, net of related debt | ||||||
| 0 | 8372913.99 | 8372913.99 | ||||
| Unrestricted/Unreserved | ||||||
| 0 | 548561.74 | 548561.74 | ||||
| TOTAL FUND BALANCES/NET ASSETS | 1016350.56 | 8921475.73 | 9937826.29 | |||
| TOTAL LIABILITIES & FUND BALANCES/NET ASSETS | 1021619.9 | 10422020.26 | 11443640.16 |
Cash and Investment Report
December 31, 2019
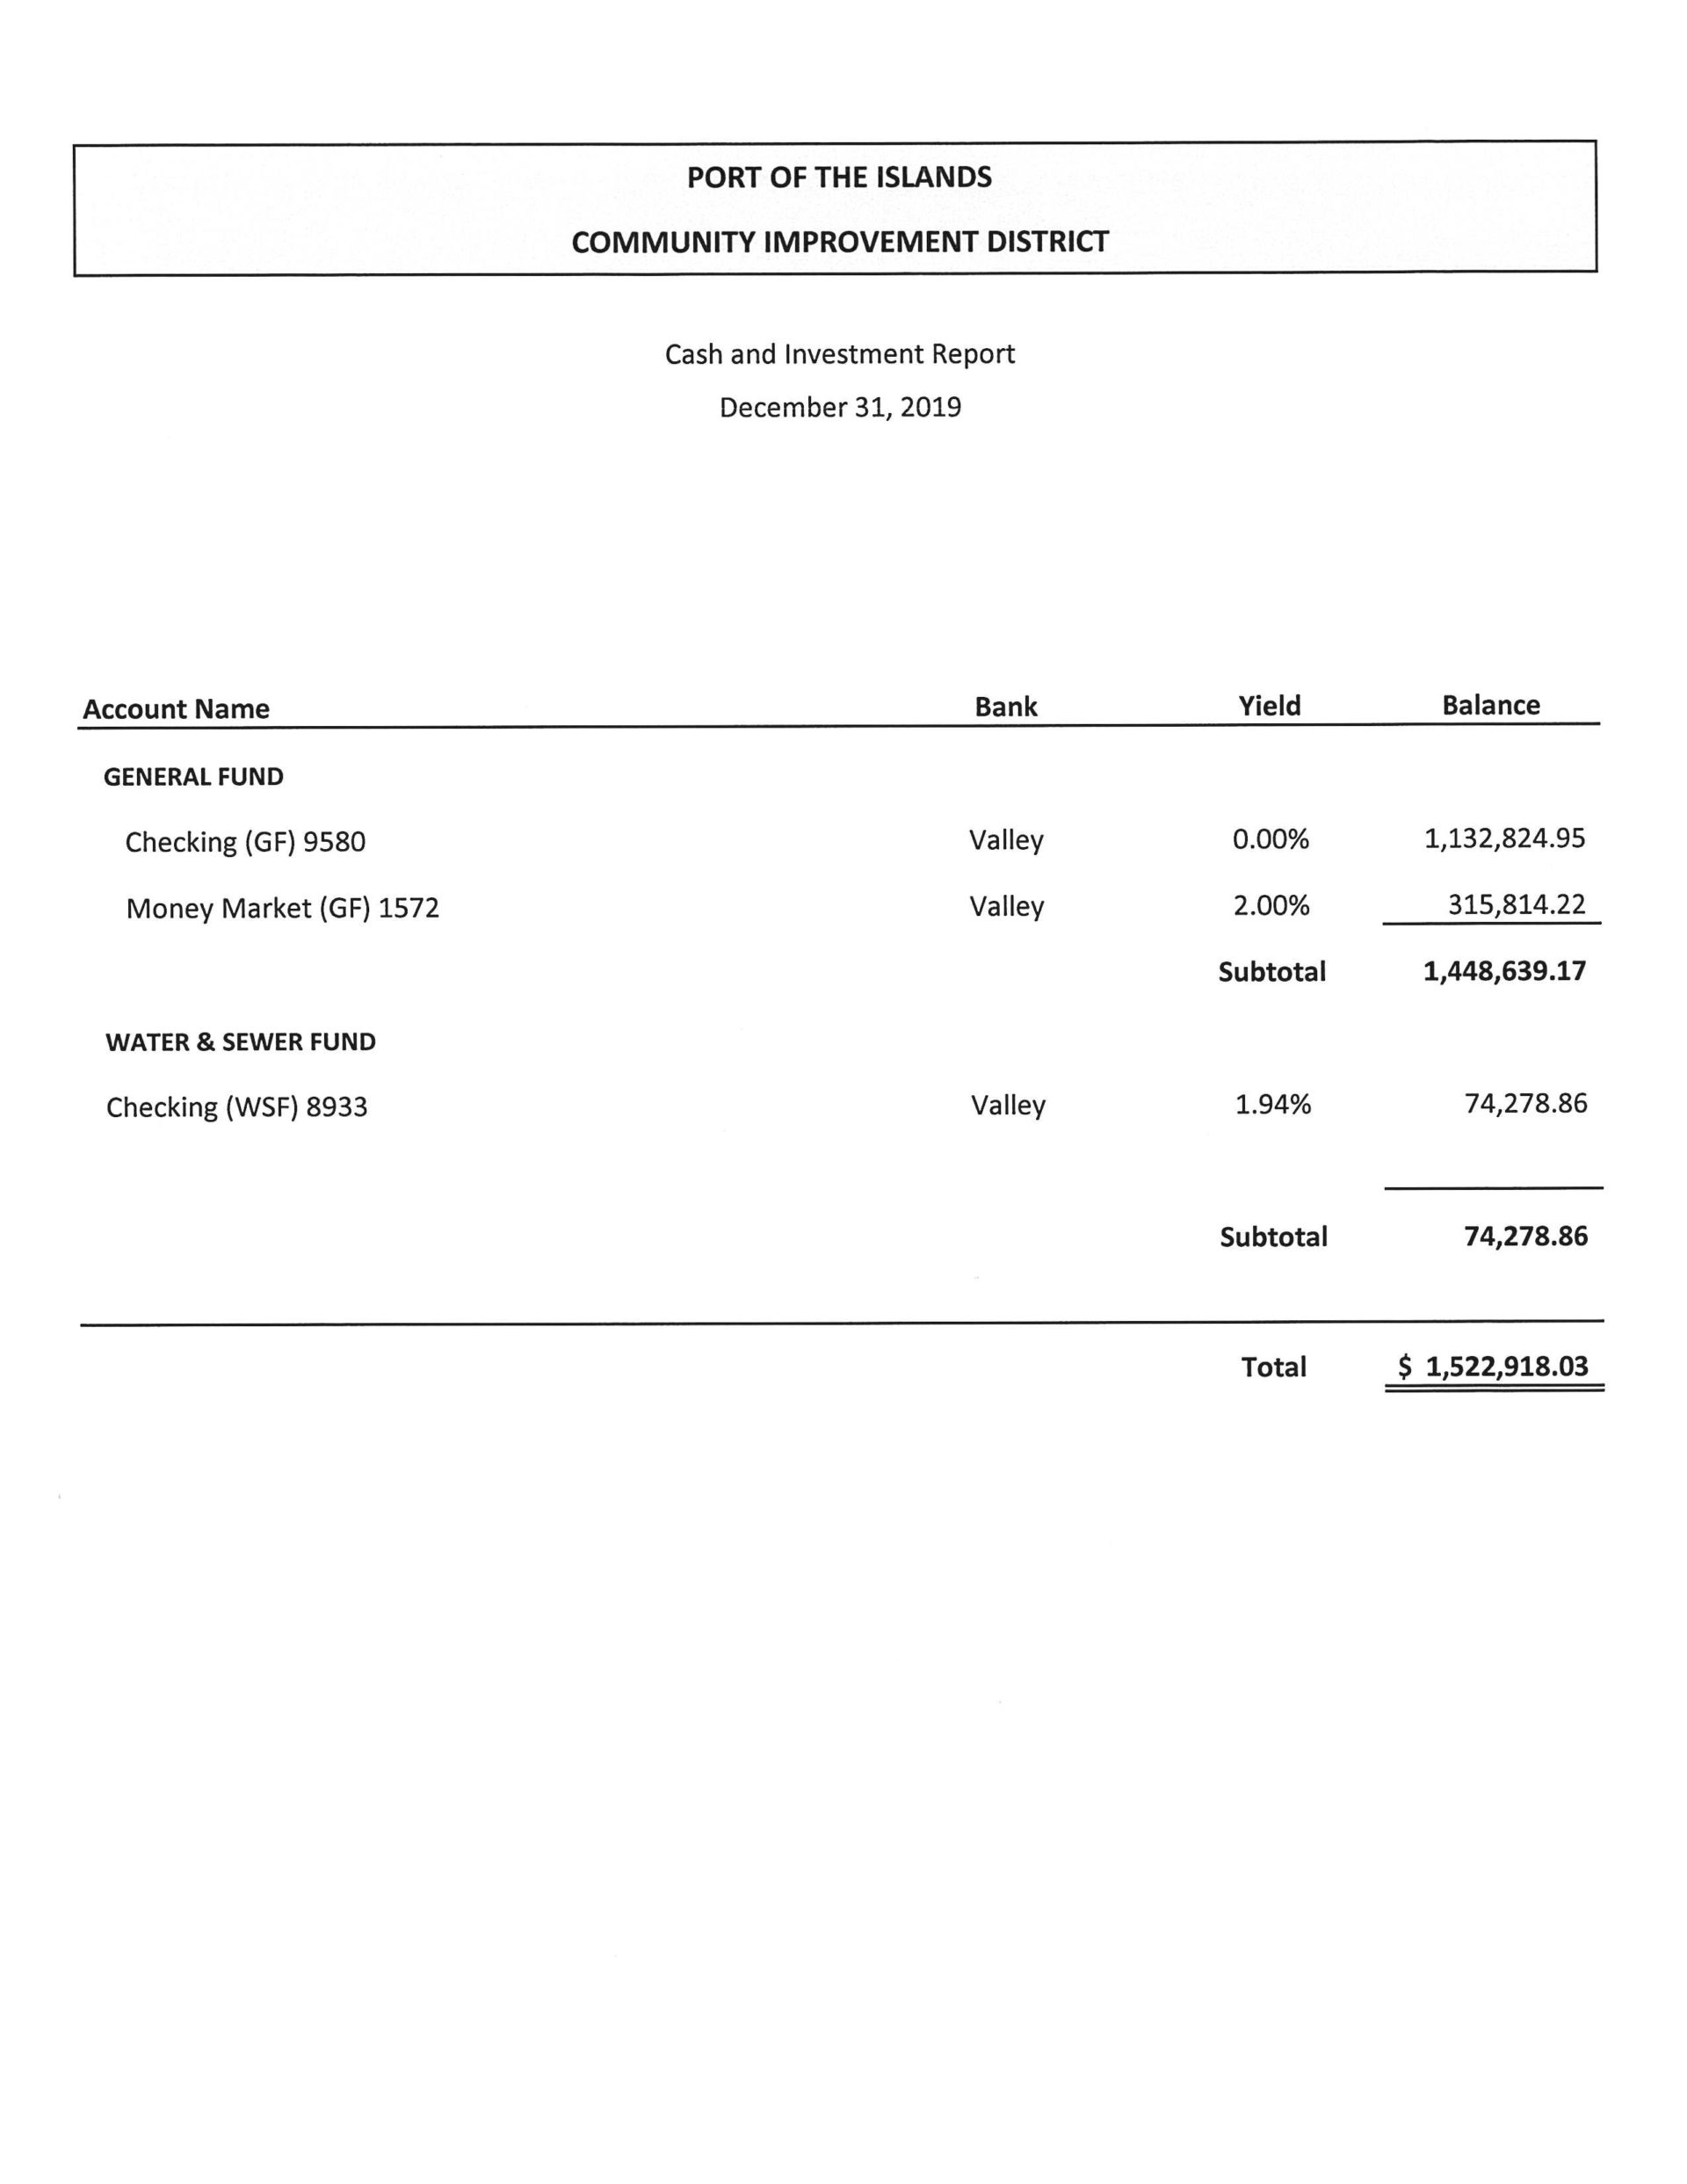
| PORT OF THE ISLANDS | ||||||||
|---|---|---|---|---|---|---|---|---|
| COMMUNITY IMPROVEMENT DISTRICT | ||||||||
| Cash and Investment Report | ||||||||
| 2019-12-31 00:00:00 | 1970-01-01 00:00:00 | 1970-01-01 00:00:00 | 1970-01-01 00:00:00 | |||||
| Account Name | Bank | Yield | Balance | |||||
| GENERAL FUND | ||||||||
| Checking (GF) 9580 | Valley | 0 | 1132824.95 | |||||
| Money Market (GF) 1572 | Valley | 0.02 | 315814.22 | |||||
| Subtotal | 1448639.17 | |||||||
| WATER & SEWER FUND | ||||||||
| Checking (WSF) 8933 | Valley | 0.0194 | 74278.86 | |||||
| Subtotal | 74278.86 | |||||||
| Total | 1522918.03 | |||||||
Special Assessments
December 31, 2019
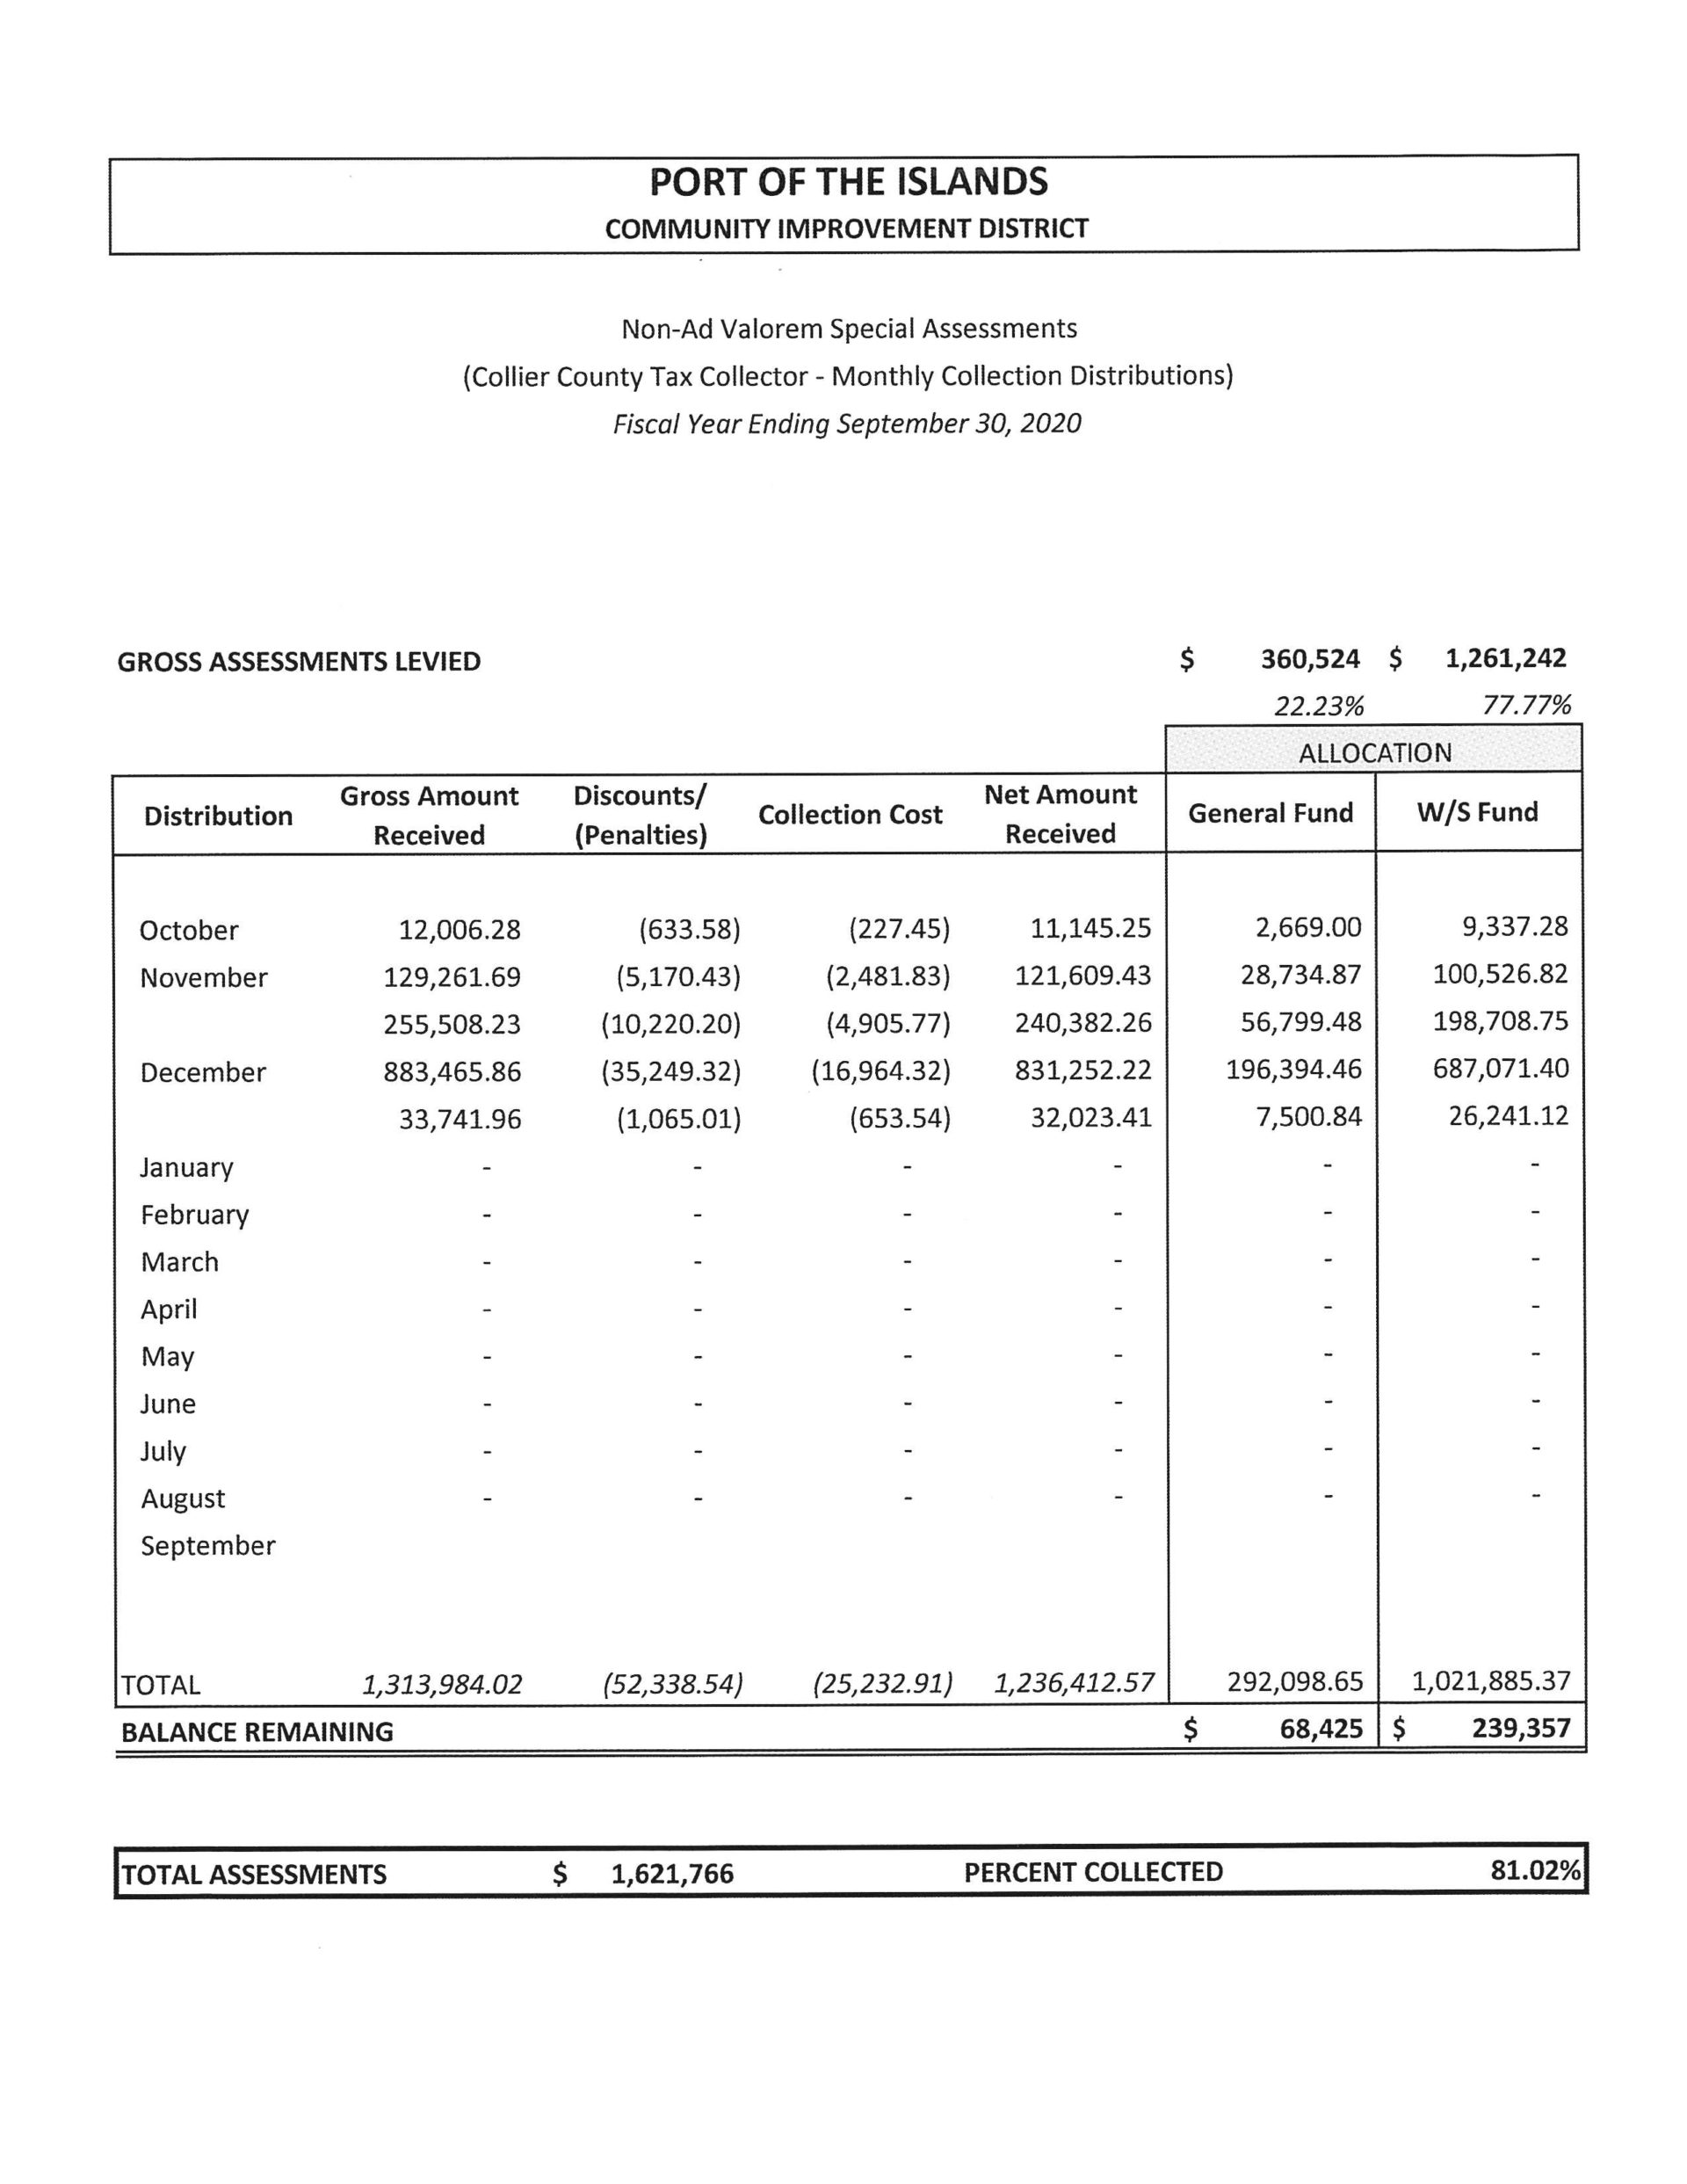
| PORT OF THE ISLANDS | PORT OF THE ISLANDS | |||||||||
|---|---|---|---|---|---|---|---|---|---|---|
| COMMUNITY IMPROVEMENT DISTRICT | COMMUNITY IMPROVEMENT DISTRICT | |||||||||
| Non-Ad Valorem Special Assessments | Net Assessment Revenue | |||||||||
| (Collier County Tax Collector – Monthly Collection Distributions) | 2019-09-30 00:00:00 | 1970-01-01 00:00:00 | 1970-01-01 00:00:00 | |||||||
| Fiscal Year Ending September 30, 2020 | ||||||||||
| GROSS ASSESSMENTS LEVIED | 360524 | 1261242 | ||||||||
| 0.2223 | 0.7777 | |||||||||
| ALLOCATION | ALLOCATION (net amt) | |||||||||
| Distribution | Gross Amount Received | Discounts/ (Penalties) | Collection Cost | Net Amount Received | General Fund | W/S Fund | General Fund | W/S Fund | Water/Sewer Total | |
| October | 12006.28 | -633.58 | -227.45 | 11145.25 | 2668.996044 | 9337.283956 | 0 | 0 | 0 | |
| November | 129261.69 | -5170.43 | -2481.83 | 121609.43 | 28734.873687 | 100526.816313 | 27033.776289 | 94575.653711 | 94575.653711 | |
| 255508.23 | -10220.2 | -4905.77 | 240382.26 | 56799.479529 | 198708.750471 | 53436.976398 | 186945.283602 | 186945.283602 | ||
| December | 883465.86 | -35249.32 | -16964.32 | 831252.22 | 196394.460678 | 687071.399322 | 184787.368506 | 646464.851494 | #REF! | |
| 33741.96 | -1065.01 | -653.54 | 32023.41 | 7500.837708 | 26241.122292 | 7118.804043 | 24904.605957 | #REF! | ||
| January | 0 | 0 | 0 | 0 | 0 | 0 | 0 | 0 | #REF! | |
| February | 0 | 0 | 0 | 0 | 0 | 0 | 0 | 0 | #REF! | |
| March | 0 | 0 | 0 | 0 | 0 | 0 | 0 | 0 | #REF! | |
| April | 0 | 0 | 0 | 0 | 0 | 0 | 0 | 0 | #REF! | |
| May | 0 | 0 | 0 | 0 | 0 | 0 | 0 | 0 | #REF! | |
| June | 0 | 0 | 0 | 0 | 0 | 0 | 0 | 0 | #REF! | |
| July | 0 | 0 | 0 | 0 | 0 | 0 | ||||
| August | 0 | 0 | 0 | 0 | 0 | 0 | ||||
| September | ||||||||||
| 272376.925236 | 952890.394764 | |||||||||
| TOTAL | 1313984.02 | -52338.54 | -25232.91 | 1236412.57 | 292098.647646 | 1021885.372354 | PREVIOUSLY TRANSFERRED | 500513.22 | ||
| BALANCE REMAINING | 68425.352354 | 239356.627646 | BALANCE REMAINING | #REF! | ||||||
| TOTAL ASSESSMENTS | 1621766 | PERCENT COLLECTED | 0.81021800925658 | |||||||